Battery Life Cycle Tester: What Cycle Count Alone Cannot Tell You
A battery life cycle tester runs a cell through hundreds of charge and discharge sequences and reports a cycle count at end of life. The number is useful. It is also incomplete. Two VRLA cells that both reach 80 percent capacity retention at cycle 200 carry the same headline rating but ship into very different warranty exposure profiles. The data that tells them apart sits in the per-cycle log on the same instrument that ran the test. That is the data your warranty desk needs six to eight months before the first claim arrives.
What a Battery Life Cycle Tester Actually Measures Beyond Cycle Count
Cycle count is the headline. The instrument captures four other variables that matter more for predicting field performance: capacity retention per cycle, AH efficiency, WH efficiency, and the cell temperature recorded alongside each cycle. IS 1651 Clause 12 mandates temperature logging during life cycle testing. Most validation reports list it as a single ambient value and miss the per-cycle drift that explains accelerated degradation in summer batches.
AH efficiency compares amp-hours put in during charge against amp-hours recovered on discharge. For a healthy 100 Ah VRLA cell, the figure sits between 82 and 85 percent. Cells with weak plate formation or early sulphation read consistently below 78 percent. WH efficiency accounts for the voltage gap between charge (around 2.4 V per cell) and discharge (2.0 to 1.75 V per cell). Healthy cells return 72 to 78 percent of the watt-hours put in. A cell with higher internal resistance drops below 68 percent WH efficiency before the AH figure shows significant change.
Both efficiency tests run on the same life cycle tester and add 10 to 12 hours to the test sequence. The two figures belong on your product datasheet. Most Indian manufacturers publish AH efficiency and leave WH efficiency off the document. Buyers in data centre, telecom float, and industrial UPS procurement run total-cost-of-ownership models on WH. That gap is a commercial opening your competitors will close before you do.
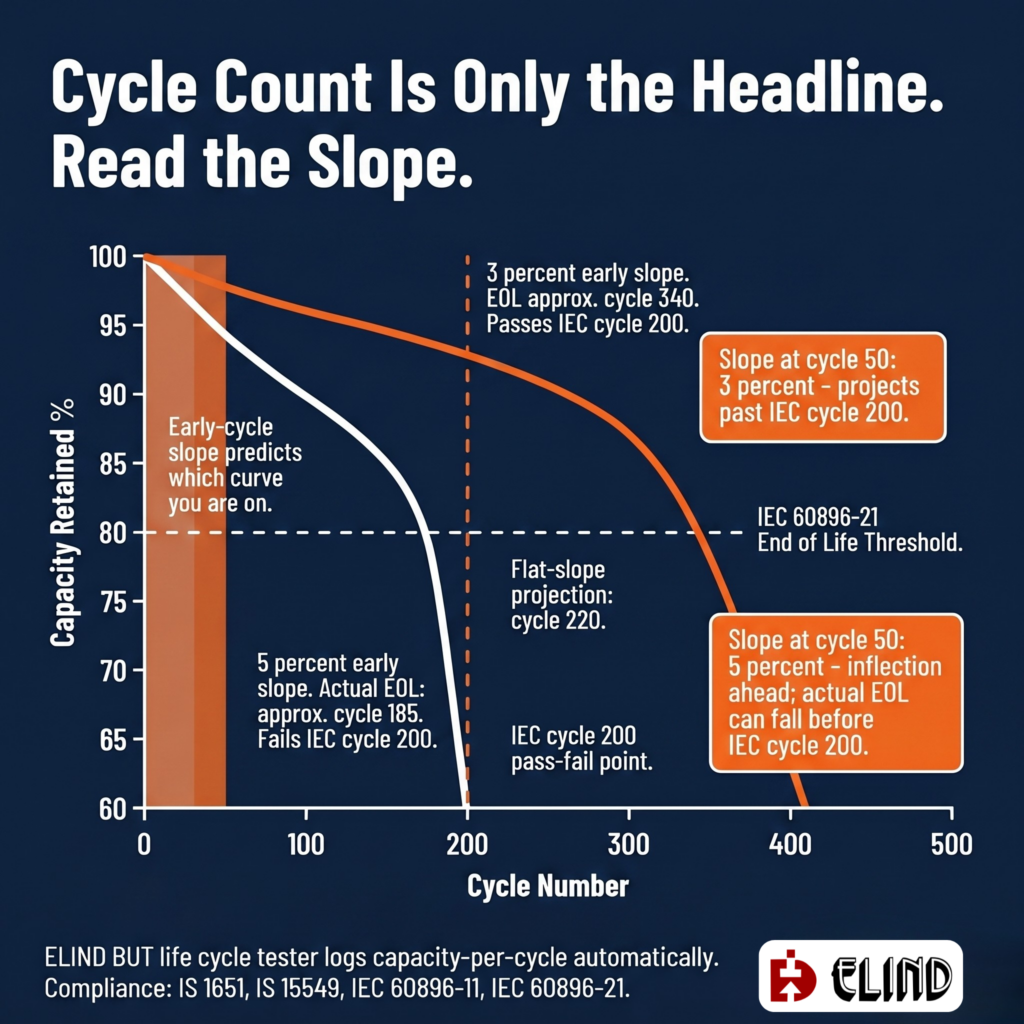
Read the Slope from Cycle 1 to Cycle 100, Not the Threshold at Cycle 200
IEC 60896-21 requires a VRLA cell to retain 80 percent of rated capacity at cycle 200. Most Indian manufacturers validate to 40 or 50 cycles and extrapolate. The extrapolation consistently underestimates failure by 30 to 40 cycles. The inflection point in a degradation curve appears between cycle 55 and cycle 70 of total rated life, which means short tests run entirely in the early stable phase and miss the steepening slope.
The calculation starts at cycle 50. A cell losing 3 percent of capacity per 50 cycles projects to an 80-percent crossing at around cycle 365 if the slope stays flat; comfortably above the IEC cycle 200 threshold. A cell losing 5 percent projects to around cycle 220 on the same flat-slope assumption. The slope does not stay flat. The inflection point, where capacity loss per cycle accelerates, appears at 55 to 65 percent of expected cycle life. For the 5-percent-slope cell, the inflection arrives around cycle 120. After that, the slope steepens and the actual 80-percent crossing falls to approximately cycle 185; below the IEC cycle 200 requirement, despite the 50-cycle extrapolation suggesting a pass. If the gap between cycles 100 and 150 is more than twice the gap between cycles 50 and 100, the slope has inflected and the batch needs a hold before release.
Running the test at C5 rate instead of C10 compresses a 200-cycle sequence from three to four weeks down to 10 to 12 days without changing the slope data. The argument for truncating the test disappears the moment a faster rate is configurable on the same instrument.
Why Lab Cycle Tests at Full C10 Miss Solar Field Failure
A VRLA cell rated for 300 cycles under IEC reference conditions can fail at 80 to 120 cycles under continuous partial-state-of-charge operation in a solar street lighting or off-grid installation. The cell never reaches 100 percent state of charge between cycles. Sulphate accumulates progressively, plate area drops, internal resistance rises, and capacity falls three to four times faster than a standard C10 cycle test predicts.
Standard validation protocols use full C10 cycles at 25 degrees Celsius and predict field life based on that data. For a customer running batteries in a correctly sized solar system, the prediction is accurate. For a customer running batteries on an undersized solar panel in Rajasthan, the prediction is wrong by a factor of three. The warranty claim arrives at six to eight months. The product was warranted for three years.
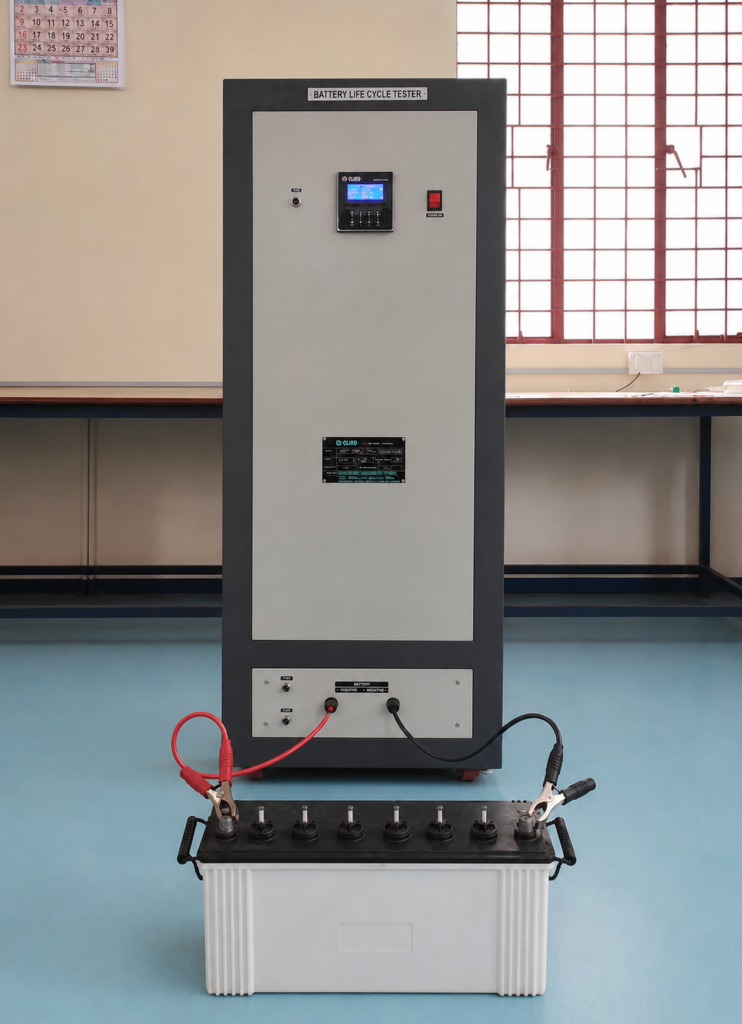
The fix is a partial-state-of-charge cycle sequence run alongside the standard C10 test on every batch destined for solar or off-grid applications. Cycle to 50 percent depth of discharge, recharge to 80 percent state of charge instead of 100 percent, repeat. The ELIND BUT 12-50 and BUT 12-100 life cycle testers run this profile through their 10-step programmable controller. The instrument logs voltage, current, AH, WH, and temperature at every cycle, which is the data the warranty calculation needs.
What to Look For in a Battery Life Cycle Tester
- Programmable multi-step profiles with charge, discharge, and pause modes per step, and user-configurable termination on time, voltage, or AH count.
- Constant current accuracy of ±1 percent across 10 to 100 percent of full-scale range. Drift in regulation invalidates slope comparisons across the test.
- Temperature logging alongside electrical parameters on every cycle. IS 1651 Clause 12 requires it. Most validation reports miss it.
- Spreadsheet data export covering voltage, current, time, AH, WH, current step, current cycle, and termination condition. Per-cycle granularity is what makes slope analysis possible.
- Compliance support for IS 1651, IS 15549, IS 1652, IEC 60095-1, and IEC 60896-11 and 21. These are the standards your export buyers and OEMs cite in their procurement terms.
- PLC-based controller for industrial-grade reliability in order to survive 24 by 7 operation on a factory floor across an Indian summer.
A battery life cycle tester is a capital decision. The wrong specification delivers a number your buyers will not accept and a dataset your warranty desk cannot defend. The right specification delivers the slope, the efficiency figures, and the temperature record that tell you what will happen in the field before the field tells you.
Talk to ELIND about the BUT life cycle tester for your validation lab
ELIND Technologies has been manufacturing battery testing equipment from Bengaluru since 1980. The BUT series life cycle testers run all standard life cycle, capacity, overcharge endurance, and AH/WH efficiency tests on one instrument. Every unit logs temperature alongside electrical parameters for IS 1651 Clause 12 compliance.
If you are specifying a life cycle tester for a new validation lab or upgrading an existing setup, email or call us / drop us a message on WhatsApp with your battery chemistry, capacity range, and the standards you certify against. We will send a configuration recommendation within 48 hours.